Note: If you're a Classic user, please log in to your account to access the dedicated Classic Help Center.
When you log in to your MailerLite account, you will land on your dashboard. Here you’ll find an overview of your account activity for your review.
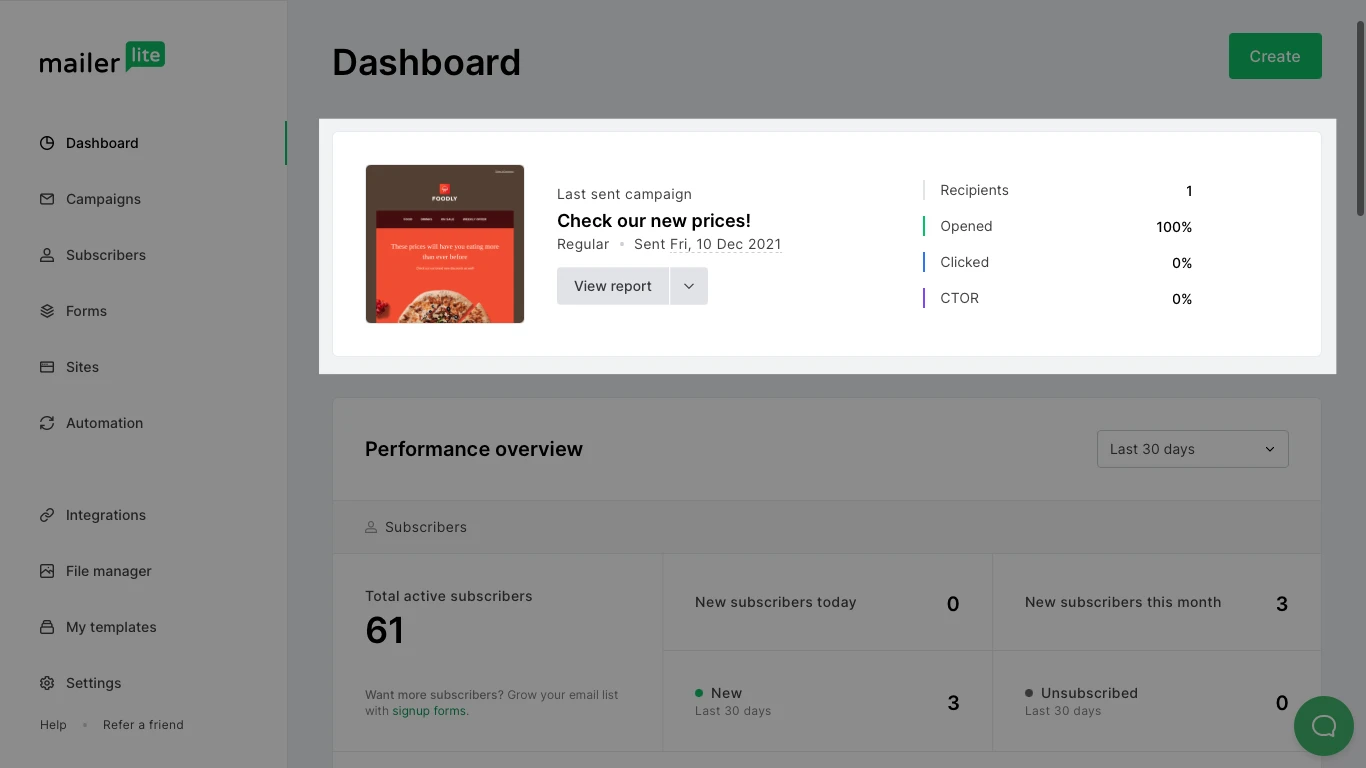
First, you will see the statistics of your last sent campaign, which includes the number of recipients, and the rates of opens, clicks, and CTOR (click-to-open rate). You can also click View report to access a much more detailed report of the campaign.
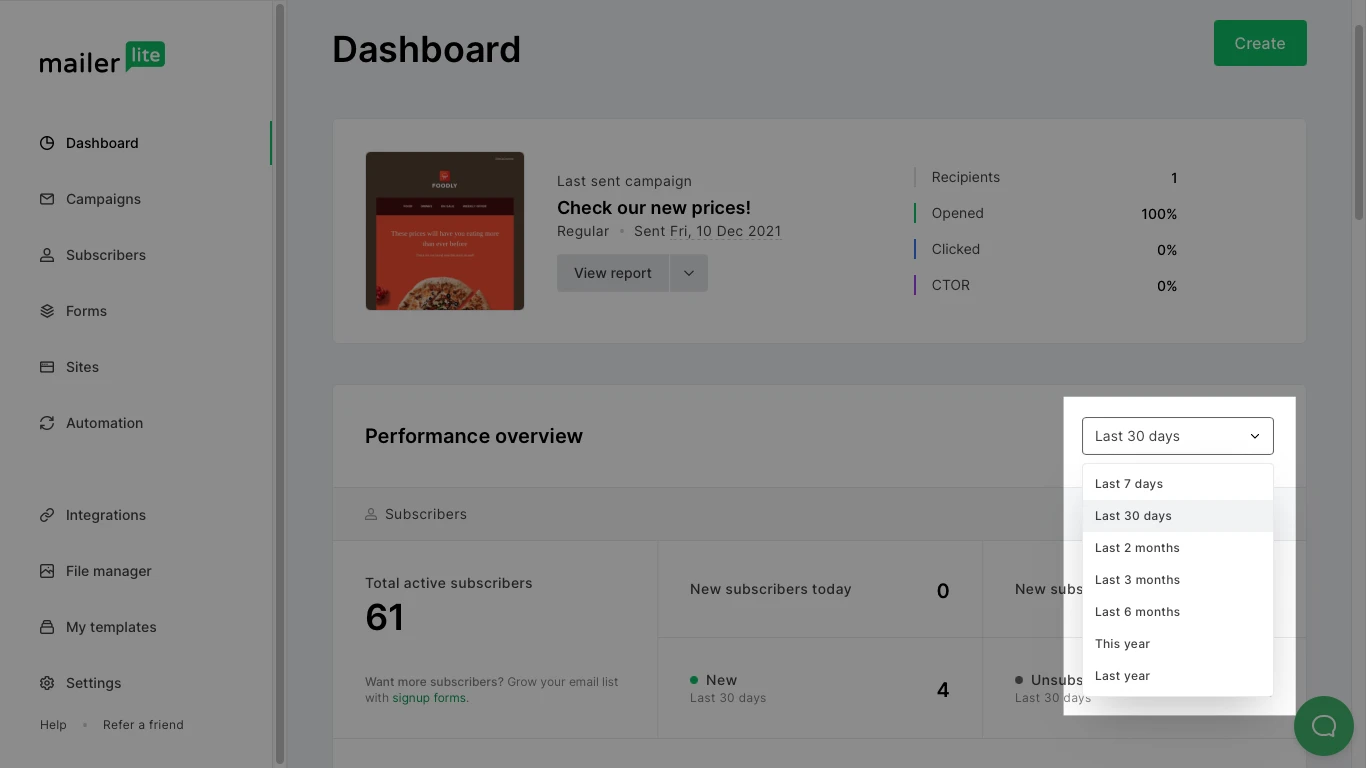
Afterwards, you will find the performance overview reports for your subscribers, campaigns, automations, forms, and sites. You can filter these reports by time: last 7 days, last 30 days, last 2 months, last 3 months, last 6 months, this year, or last year.
Performance overview: Subscribers
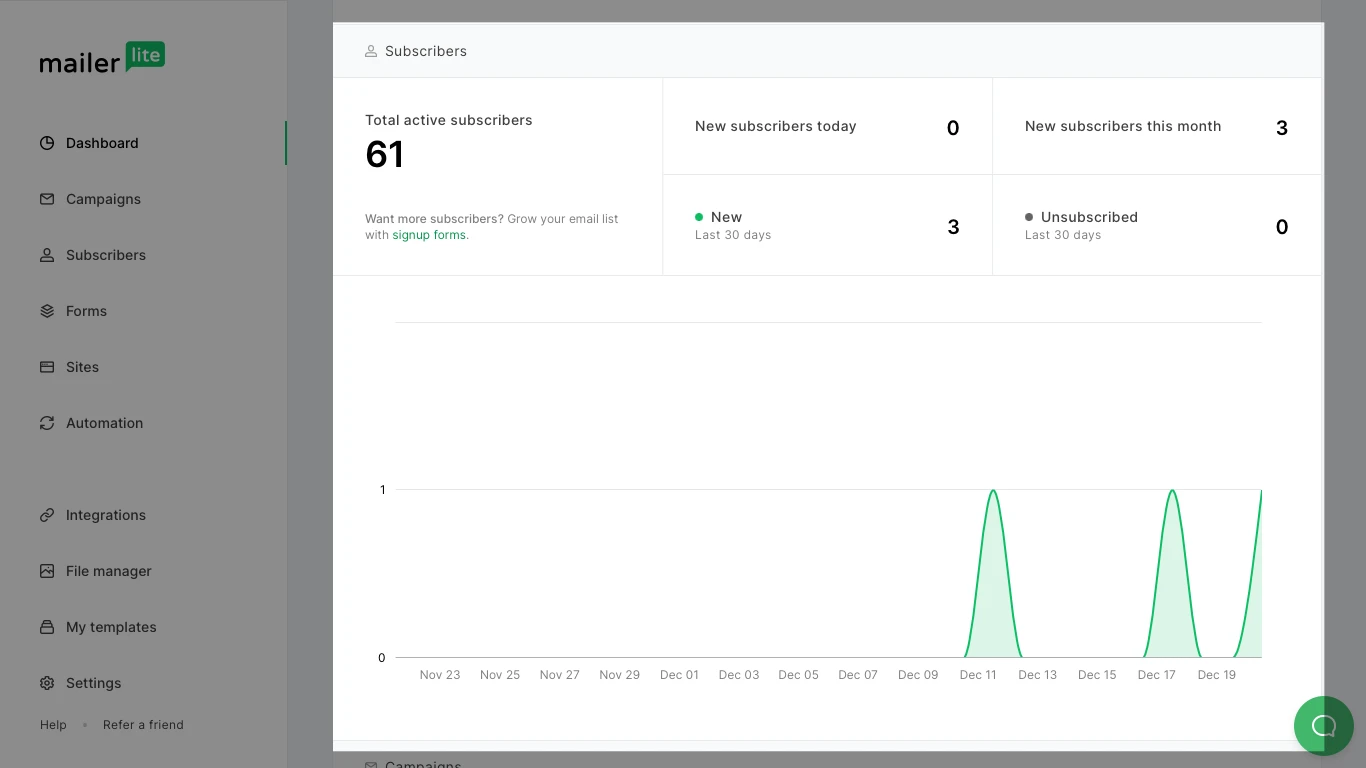
The Subscribers section gives you the following information:
Total active subscribers - The amount of active subscribers in your list, which excludes unsubscribers, spam complaints, bounces, and deleted subscribers.
New subscribers today - The amount of active subscribers that have signed up to your list today.
New - The amount of new active subscribers who have signed up to your list in the chosen timeframe.
New subscribers this month - The amount of new active subscribers who have signed up to your list in the current month.
Unsubscribed - The amount of subscribers who have opted to unsubscribe from your list in the specified timeframe.
You can find a graph of subscribes vs unsubscribes below these statistics in the specified timeframe.
Performance overview: Campaigns
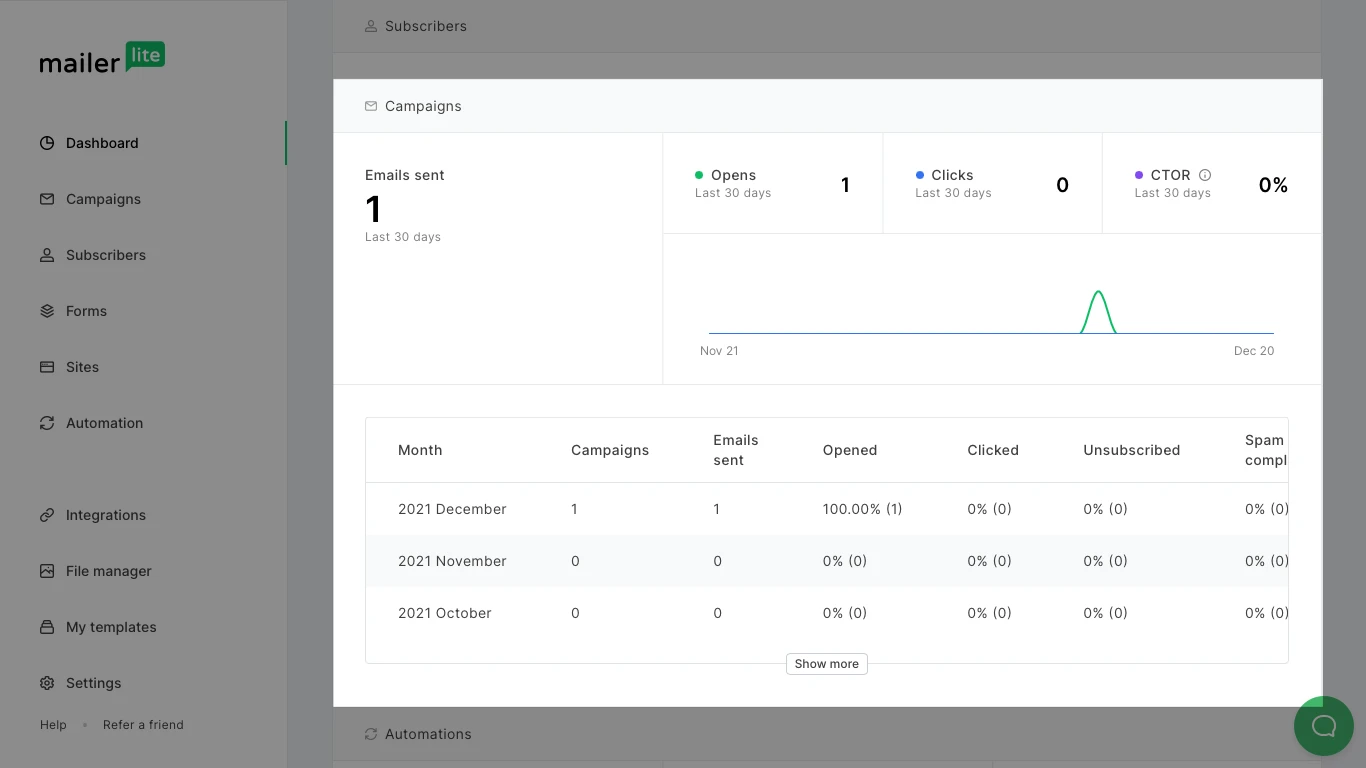
The Campaigns section gives you the following information:
Emails sent - The amount of emails sent in the chosen timeframe.
Opens - The amount of times your emails have been opened.
Clicks - The amount of times your emails have had a link clicked.
CTOR - The click-to-open rate (number of unique clicks divided by the number of unique opens, times 100).
You can find a graph of opens vs clicks below these statistics, as well as a table that also shows the rates for unsubscribes and spam complaints per month.
Performance overview: Automations
The Automations section gives you the following information:
Active automation workflows - The amount of workflows that are currently active and not paused.
Subscribers in the queue - The amount of subscribers currently in a delay step.
Emails sent - The amount of emails sent in all automation workflows in the chosen timeframe.
Completed subscribers - The amount of subscribers who have completed an automation workflow in the chosen timeframe.
Unsubscribed - The amount of subscribers who have unsubscribed directly from any of your automation emails in the chosen timeframe.
Most completed automation workflows - The workflows which have been completed the most in the chosen timeframe.
Performance overview: Forms
The Forms section gives you the following information:
All active forms - The amount of forms (pop-ups, embedded, promotion) that are active and not paused.
Signups - The amount of signups your forms have had in the chosen timeframe.
Average conversion rate - The amount of signups divided by the amount of visits your form has had, times 100, in the chosen timeframe.
Top subscribed forms - The forms with the most signups in the chosen timeframe.
Performance overview: Sites
The Sites section gives you the following information:
All published sites - The amount of sites (landing pages and websites) that are published.
Signups - The amount of signups the forms in your sites have had in the chosen timeframe.
Average conversion rate - The amount of signups divided by the amount of visits your form has had, times 100, in the chosen timeframe.
Top subscribed sites - The sites with the most signups in the chosen timeframe.